
HIGH-TECH LABCOURSES
HIGH-TECH
LABCOURSES
Wave turbulence
Wave turbulence refers to a statistical state that describes a nonlinear, random ensemble of waves, as commonly observed on the ocean’s surface. Since the 1960s, a theoretical framework known as Weak Turbulence Theory has been developed to model cases where nonlinearity is weak. However, whether this theory can accurately describe real-world systems remains an open question.
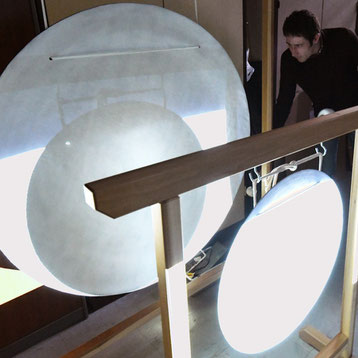
In this project, we will focus on a solid system that supports elastic waves: a vibrating elastic plate, or more precisely—a gong! The rich and distinctive sound of a gong arises from the nonlinear transfer of energy from low-frequency excited modes to higher-frequency ones, a phenomenon known as the energy cascade of turbulence.
In this lab course, we will introduce a profilometry technique based on high-speed imaging, enabling us to capture the gong’s vibrations with both spatial and temporal resolution. This will allow for an in-depth exploration of the physical properties underlying the gong’s unique sound.
PREREQUISITE
This lab course is well-suited for M1 and M2 students with a background in continuum mechanics (either solid or fluid mechanics), and a basic understanding of statistical and Fourier analysis.
DESCRIPTION
Observing the deformation through high-speed imaging and analyzing the statistical properties of wave turbulence.
We will investigate wave turbulence in a gong. Initially, the vibrations of the gong will be studied through spectral analysis of acoustic measurements. In the second phase, high-speed imaging will be employed to gain deeper insights. A pattern will be projected onto the plate and captured by a high-speed camera. A straightforward algorithm will be used to invert the deformation of the recorded pattern, allowing us to measure the displacement of the plate. This approach provides a 2D space-time resolution of the vibrations.U
sing space-time Fourier analysis, we will explore the statistical properties of the observed wave turbulence, with particular focus on the persistence of the waves.


LOCATION
Laboratory LEGI
1211 rue de la piscine
(see map below)